
Hypothesis
Operational hypothesis: The working class of society are more likely than the upper class to disagree with the statement that immigrants contribute a lot.
Null hypothesis: The working class of society are not more likely than the upper class to disagree with the statement that immigrants contribute a lot.
Introduction
The following report analyses secondary data from the Eurobarometer data service. The European Commission established the Eurobarometer in 1973, with the aim of providing a series of public opinion surveys that addresses a wide variety of issues related to the Member States of the European Union. The data set analysed in the following report originates from data officially released by the Eurobarometer in March 2014.
The software used for statistical analysis in the report is ‘IBM SPSS Statistics’. This programme is used widely as a tool for statistical analysis within a variety of fields such as social science, market research and health analytics. According to the solution brief on the IBM website, SPSS Statistics is proficient at making sense of complex patterns and associations, enabling users to draw conclusions, and make predictions, ultimately improving decision-making (IBM, 2013).
The two variables within the data examined in the report are ‘Social Class’ and ‘Statement: immigrants contribute a lot’ (which will be referred to as ‘Immigrant Contribution’). The ‘Social Class’ variable is a nominal variable type, with set categories that have no logical or progressive order. The ‘Immigrant Contribution’ variable is an ordinal type of variable, with an ordered set of responses, gauging from ‘totally agree’ to ‘totally disagree’. The Independent Variable (IV) is ‘Social Class’, as this is the variable which has influence over the other and in this circumstance cannot be changed. The Dependent Variable (DV) is ‘Immigrant Contribution’, as the IV will influence this variable. In other words, the perception of immigrant contribution (DV) could change based upon particular social class (IV).
In the interest of data analysis, the ‘Social Class’ variable, which originally contained seven different categories for participants to place themselves, is recoded to contain fewer categories. To elaborate, the original categories: ‘Other (SPONT.)’, ‘None (SPONT.)’, ‘Refusal (SPONT.)’, and ‘DK’, are combined into just one category, simply named ‘Other’. As a result, seven categories are reduced to just four categories, including: ‘Working Class’, ‘Middle Class’, ‘Upper Class’, and ‘Other’. This reduces the amount of information to examine, without losing relevant data needed for analysis, allowing for more concise and efficient data analysis.
The report is structured as follows: first, the variables are contextualised, providing an account into the reasons why the two variables were chosen for analysis, including information regarding previous work and theories related to both variables. Second, the data is presented in tables and graphs ready for analysis. Essential information needed to establish whether a relationship exists between the variables is provided, including cross-tabulations, Chi-square and Cramer’s V. Next, the data presented is analysed and critically reviewed, and final conclusions are drawn, referring to the validity of the hypothesis.
Contextualisation of Variables
Immigration is an extremely contemporary topic that has become one of the most important issues discussed in politics today. 50% of the British public named immigration as one of the most important issues facing Britain, with 32% voting it as the single most important (Ipsos MORI, 2015). According to another study, immigration is the most important issue selected by the British public (45%), followed by the NHS (40%) and then the economy (26%) (Blinder, 2015). A further study revealed that large majorities in both Greece (86%) and Italy (80%) want to reduce the number of immigrants coming into their countries; with more than half of the British and French populations holding this view, and 47% of Spanish (Pew Research Center, 2014, p.26).
The results of these studies may explain the recent rise of anti-mass immigration parties across Europe, including the Swiss People’s Army, the Danish People’s Party, the Swedish Democrats, the French National Front, the Austrian Freedom Party and the UK Independence Party (UKIP) (Recknagel, 2015; Robins-Early, 2015). Notably, UKIP have gained an increasing amount of support in working class areas of Britain. An article by The Independent claims that UKIP has overcome the Labour party as the party of the working classes (Blackhurst, 2014). Further articles in The Guardian (Healey, 2015) and The Daily Mail (Chorley, 2014) share this view; two newspapers that are typically on opposite sides of the political spectrum.
This report aims to determine whether there is a correlation between social class and perceptions on immigration. The hypothesis being, that the working class are more likely to have a negative view of immigration than the upper class. However, reasons for this can only be speculated.
One potential explanation could be because a large percentage of immigrants who migrate into the country tend to directly compete with the working class for jobs. Therefore, a larger number of working class are more likely to have negative perceptions of immigration than that of upper and middle classes, who face less competition from immigrants.
A different, but relevant argument claims that immigration is making rich people richer and poor people poorer. According to the article, immigration allows the rich to prosper due to the cheap labour associated with migrants. Whereas the poor are unable to compete with migrants who are willing to work for less than living wage (Toynbee, 2006).
Critics of immigration also cite possible social issues, such as increases in crime rate and terrorist threat, as reasons to tighten immigration. In addition, the increasing population size potentially leads to a number of social issues, such as overcrowding, housing shortages, congestion, pollution, and pressure on welfare and public services (Pettinger, 2015).
On the other hand, some evidence suggests that the positives of immigration outweigh the negatives. The consensus amongst both left wing and right wing economists is in favour of immigration (Thoma, 2006). Their argument being, that it benefits the economy, as it increases labour market supply and demand, leading to an increase in the potential output capacity of the economy, with an increase in aggregate demand (Pettinger, 2015). However, others point this out as only true in the case of ‘skilled’ migrants. Entrepreneurially speaking, there is however an argument to suggest that immigration has a net positive effect; creating businesses, employment, increasing consumption whilst also paying taxes, all of which provide a healthy contribution to the economy (Prosser, 2015).
An alternative view highlights the role the mainstream media plays in generating adverse perceptions of immigration. According to this view, media outlets tend to dehumanise immigrants and create an “enemy at the gates” mentality, rather than shifting focus on positive contributions by immigrants (Esses, Medianu and Lawson, 2013). This view suggests that the public are highly susceptible to negative influences portrayed by media, in particular the working classes.
To conclude, there are a variety of arguments for and against limiting immigration. This report aims to identify whether a connection between social class and opinion of immigrants does or does not exist.
Presentation of Data
| Frequency | Percent | Cumulative Percent | ||
| Valid | Working Class | 12160 | 43.5 | 43.5 |
| Middle Class | 13833 | 49.5 | 93.1 | |
| Upper Class | 806 | 2.9 | 95.9 | |
| Other | 1133 | 4.1 | 100.0 | |
| Total | 27932 | 100.0 | ||
Figure 1: Frequency table displaying respondents’ self-assessment of Social Class
This table shows the frequency in which Eurobarometer survey respondents’ placed themselves in a social class category. Data shows that the majority of participants identified themselves as ‘Middle Class’ (49.5%), with ‘Working Class’ the second most prevalent (43.5%). A very small number of participants assessed themselves as ‘Upper Class’ (2.9%) or ‘Other’ (4.1%).
Figure 2: Bar graph displaying respondents’ self-assessment of Social Class
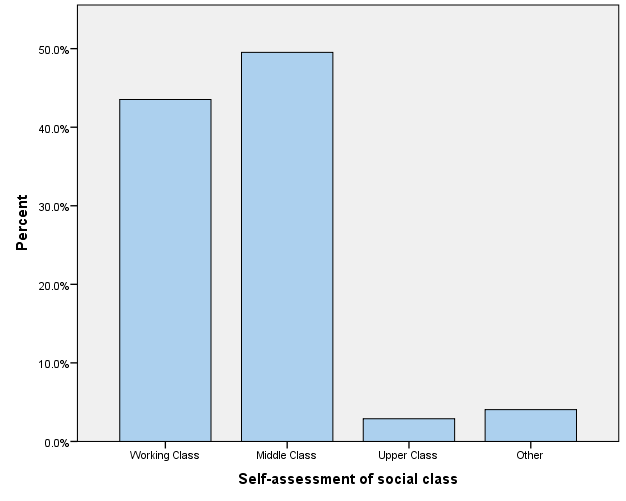
Figure 3: Frequency table displaying respondent’s opinion of the statement: immigrants contribute a lot
|
|
Frequency | Percent | Cumulative Percent | |
| Valid | Totally agree | 3106 | 11.1 | 11.1 |
| Tend to agree | 8875 | 31.8 | 42.9 | |
| Tend to disagree | 8680 | 31.1 | 74.0 | |
| Totally disagree | 5485 | 19.6 | 93.6 | |
| DK | 1786 | 6.4 | 100.0 | |
| Total | 27932 | 100.0 | ||
This table shows the frequency in which Eurobarometer survey participants responded to the statement: immigrants contribute a lot. The majority of people ‘tend to agree’ that immigrants contribute a lot (31.8%), with ‘tend to disagree’ closely second (31.1%). More people ‘totally disagree’ with the statement (19.6%) than ‘totally agree’ with the statement (11.1%).
Figure 4: Bar graph displaying respondent’s opinion of the statement: immigrants contribute a lot
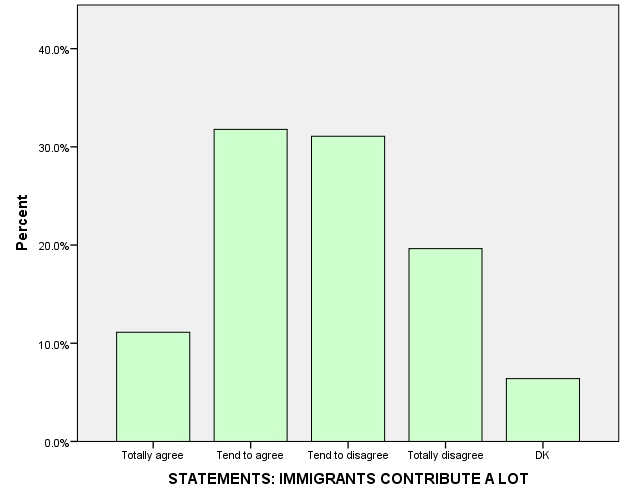
Figure 5: Table displaying Cross-tabulation of Social Class and opinion of statement: immigrants contribute a lot
| Self-assessment of social class | |||||
| Working Class | Middle Class | Upper Class | Other | ||
| STATEMENTS: IMMIGRANTS CONTRIBUTE A LOT | Totally agree | 9.4% | 12.4% | 14.6% | 11.7% |
| Tend to agree | 26.8% | 35.9% | 39.7% | 30.0% | |
| Tend to disagree | 32.8% | 30.1% | 28.8% | 26.1% | |
| Totally disagree | 23.8% | 16.4% | 12.9% | 18.7% | |
| DK | 7.3% | 5.2% | 4.0% | 13.4% | |
| Total | 100.0% | 100.0% | 100.0% | 100.0% | |
This table shows a cross-tabulation between social class and opinion of the statement that immigrants contribute a lot. The majority of the working classes tended to disagree that immigrants contribute a lot (32.8%). The majority of the middle classes (35.9%) and upper classes (39.7%) tended to agree with the statement.
Figure 6: Cluster bar graph displaying Cross-tabulation of Social Class and opinion of statement: immigrants contribute a lot
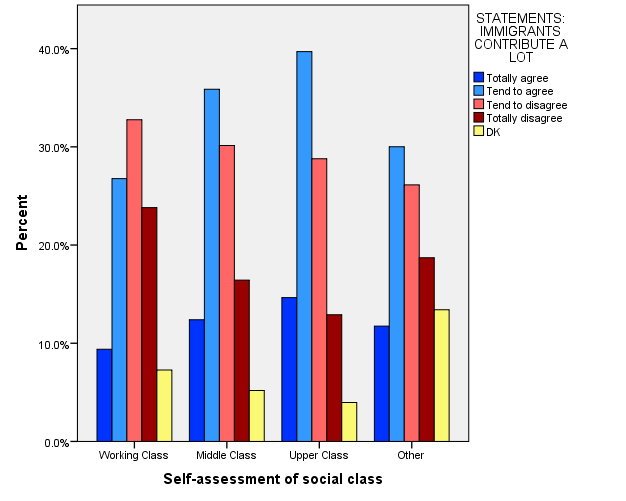
Figure 7: Scatter graph displaying Cross-tabulation of Social Class and opinion of statement: immigrants contribute a lot
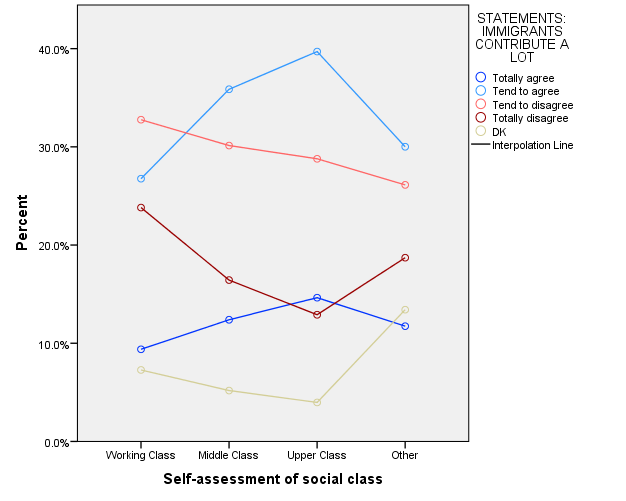
Figure 8: Table displaying Pearson’s Chi-Square test of variables
| Chi-Square Tests | |||
| Value | df | Asymp. Sig. (2-sided) | |
| Pearson Chi-Square | 614.896a | 12 | .000 |
| Likelihood Ratio | 598.503 | 12 | .000 |
| Linear-by-Linear Association | 162.219 | 1 | .000 |
| N of Valid Cases | 27932 | ||
| a. 0 cells (.0%) have expected count less than 5. The minimum expected count is 51.54. | |||
Figure 9: Table displaying Cramer’s V measure of variables
| Symmetric Measures | |||
| Value | Approx. Sig. | ||
| Nominal by Nominal | Phi | .148 | .000 |
| Cramer’s V | .086 | .000 | |
| N of Valid Cases | 27932 | ||
Figure 10: Table displaying observed and expected counts of Cross-tabulation of variables
| Self-assessment of social class | ||||||||||
| Working Class | Middle Class | Upper Class | Other | |||||||
| Count | % | Count | % | Count | % | Count | % | |||
| STATEMENTS: IMMIGRANTS CONTRIBUTE A LOT | Totally agree | Count | 1141 | 9.4 | 1714 | 12.4 | 118 | 14.6 | 133 | 11.7 |
| Expected Count | 1352.2 | 11.1 | 1538.2 | 11.1 | 89.6 | 11.1 | 126.0 | 11.1 | ||
| Tend to agree | Count | 3254 | 26.8 | 4961 | 35.9 | 320 | 39.7 | 340 | 30.0 | |
| Expected Count | 3863.7 | 31.8 | 4395.2 | 31.8 | 256.1 | 31.8 | 360.0 | 31.8 | ||
| Tend to disagree | Count | 3984 | 32.8 | 4168 | 30.1 | 232 | 28.8 | 296 | 26.1 | |
| Expected Count | 3778.8 | 31.1 | 4298.7 | 31.1 | 250.5 | 31.1 | 352.1 | 31.1 | ||
| Totally disagree | Count | 2896 | 23.8 | 2273 | 16.4 | 104 | 12.9 | 212 | 18.7 | |
| Expected Count | 2387.9 | 19.6 | 2716.4 | 19.6 | 158.3 | 19.6 | 222.5 | 19.6 | ||
| DK | Count | 885 | 7.3 | 717 | 5.2 | 32 | 4.0 | 152 | 13.4 | |
| Expected Count | 777.5 | 6.4 | 884.5 | 6.4 | 51.5 | 6.4 | 72.4 | 6.4 | ||
| Total | Count | 12160 | N/A | 13833 | N/A | 806 | N/A | 1133 | N/A | |
| Expected Count | 12160.0 | N/A | 13833.0 | N/A | 806.0 | N/A | 1133.0 | N/A | ||
This table displays the observed count, meaning the frequency that actually occurred; and the expected count, meaning the frequency estimated to occur if no relationship exists between the variables. The greater the percentage difference between the observed and expected count, the greater statistical significance there is.
Data Analysis
The Eurobarometer collected data relating to the social class that survey respondents identified themselves. The data is displayed in ‘Figure 1’ and ‘Figure 2’ in the previous section. Out of the 27,932 survey participants, the vast majority were either ‘Working Class’ (43.5%) or ‘Middle Class’ (49.5%). A very small number of participants assessed themselves as ‘Upper Class’ (2.9%) or ‘Other’ (4.1%). The ‘Other’ category includes people who either: believe that they belong to a different type of social class not listed; do not know which social class they belong to; believe they do not belong to a social class; or refuse to say which social class they belong.
Data was also collected relating to survey participants’ opinion on the statement: immigrants contribute a lot to society. This data is presented in ‘Figure 3’ and ‘Figure 4’ in the previous section. The majority of people selected the less weighted answers, such as ‘tend to agree’ (31.8%) and ‘tend to disagree’ (31.1%). Interestingly, almost twice the number of people selected ‘totally disagree’ (19.6%) than ‘totally agree’ (11.1%).
The cross-tabulation of the two variables are presented in ‘Figure 5’. The data tells us that the majority of people who identify as ‘Working Class’ tend to disagree with the statement: immigrants contribute a lot (32.8%). This is particularly interesting because every other category of social class selected ‘tend to agree’ as the most popular answer. The second most popular selected answer by the working classes is ‘tend to agree’ (26.8%), closely followed by ‘totally disagree’ (23.8%).
The most popular answer for the ‘Middle Class’ category is ‘tend to agree’ (35.9%), with 30.1% selecting ‘tend to disagree’. Similar results are displayed in the ‘Upper Class’ category, with 39.7% answering ‘tend to agree’ and 28.8% ‘tend to disagree’ with the statement. Note, this is the largest percentage difference between the categories ‘tend to agree’ and ‘tend to disagree’. Interestingly, the ‘Upper Class’ is the only social class in which a higher percentage of respondents answered ‘totally agree’ (14.6%) than ‘totally disagree’ (12.9%).
A number of patterns within the data seem to have occurred, which can best be observed on display in ‘Figure 6’ and ‘Figure 7’. One correlation is that the higher the social class an individual belongs, the more likely they are to ‘tend to agree’ and ‘totally agree’ that immigrants contribute a lot. If we are to look at both the dark blue and light blue lines on ‘Figure 7’, which represent ‘totally agree’ and ‘tend to agree’, we can see that both these lines rise as the social class gets higher, ignoring the ‘Other’ category. 26.8% of the ‘Working Class’ ‘tend to agree’ with the statement, and just 9.4% ‘totally agree’. Whereas 35.9% of ‘Middle Class’ ‘tend to agree’ and 12.4% ‘totally agree’. A substantial 39.7% of ‘Upper Class’ ‘tend to agree’ and 14.6% ‘totally agree’. Here is evidence to support a positive correlation between higher social class and agreement that immigrants contribute a lot.
Another correlation is that the lower the social class an individual belongs, the more likely they are to ‘tend to disagree’ and ‘totally disagree’ that immigrants contribute a lot. Again, on ‘Figure 7’ we can see that both the dark and light red lines, which represent ‘totally disagree’ and ‘tend to disagree’, fall as the social class increases, ignoring the ‘Other’ category. 32.8% of ‘Working Class’ ‘tend to disagree’ with the statement, and a substantial 23.8% ‘totally disagree’. Meanwhile, 30.1% of ‘Middle Class’ ‘tend to disagree’ and 16.4% ‘totally disagree’; and 28.8% of the ‘Upper Class’ ‘tend to disagree’ and just 12.9% ‘totally disagree’. Here is evidence to support a negative correlation between higher social class and disagreement that immigrants contribute a lot.
An additional relationship seems to occur in the data which is the lower the social class, the more likely they are to answer that they do not know (‘DK’) whether immigrants contribute a lot. 7.3% of ‘Working Class’ answered this way; whereas 5.2% of ‘Middle Class’ and just 4% of ‘Upper Class’. It could be speculated that it is because lower classes have less knowledge of the subject than the higher classes, alternatively it could just be that they are more humble. However, this discussion is not the topic of this report.
‘Figure 8’ in the previous section displays Pearson’s Chi-Squared test of independence, which calculates whether there is a relationship between the two variables. The Chi-Square test tells us whether we can accept or reject the operational hypothesis. According to the data, the significance figure is 0.000. This means that a relationship does exist between the variables, therefore we are more likely to accept the operational hypothesis: The working class of society are more likely than the upper class of society to disagree with the statement that immigrants contribute a lot.
‘Figure 9’ displays Cramer’s V test, which calculates the strength of the relationship between two variables. According to the data, the Cramer’s V value is 0.086, which suggests a weak association between the variables. Although a relationship between the variables does exist, this relationship is weak, perhaps due to the numerous other factors which could play a part in forming attitudes on immigration such as age, gender, and ethnicity and so on.
‘Figure 10’ displays a table showing the observed and expected counts. The observed count is the actual frequency that occurred in the data. The expected count is the frequency which is assumed to occur if no relationship exists between the variables. The Chi-Squared test establishes that a relationship does exist between the variables. The information within ‘Figure 9’ allows us to see precisely where this relationship exists. The larger the difference between the expected and observed count, the greater the statistical significance.
The social class which saw the biggest difference between observed and expected counts is the ‘Upper Class’ category. The observed counts for ‘totally agree’ and ‘tend to agree’ is much higher than expected – a difference of 3.5% for ‘totally agree’ and 7.9% for ‘tend to agree’. Furthermore, the observed counts for ‘totally disagree’ and ‘tend to disagree’ are much lower than expected – a difference of 6.7% for ‘totally disagree’ and 2.3% for ‘tend to disagree’. This tells us that upper class people have a more positive view of immigrants than expected.
Other significant differences occur between observed and expected counts in the ‘Working Class’ category. The observed count for ‘tend to agree’ is much lower than expected – just 26.8%, as opposed to the expected count which is 31.8% (a 5% difference). Alternatively, the observed count for ‘totally disagree’ is much lower than expected – 23.8%, as opposed to the expected count which is 19.6% (a 4.2% difference). This tells us that working class people have a more negative view of immigrants than expected.
Conclusion
This report has used March 2014 data from the Eurobarometer, a service which was established by the European Commission. Using the software program SPSS statistics, the report concentrated on two variables of survey data: ‘Social Class’ and ‘Immigrant Contribution’, with the aim of establishing whether a relationship exists between the social class an individual identifies and opinion of immigrants. In the interest of efficient data analysis, the ‘Social Class’ variable was recoded from 7 categories into just 4: ‘Working Class’, ‘Middle Class’, ‘Upper Class’, and ‘Other’.
The reason why these variables were chosen for analysis is because immigration is an extremely contemporary issue, with many studies suggesting that the majority of Britons view it as the most important issue facing the country, and many anti-mass immigration parties across Europe gaining support. With the growth in support of UKIP in traditionally working class areas of Britain, does it suggest that the working class are more likely to view immigrants negatively? Although this report is wholly descriptive and does not aim to determine reasons why the working class would have a more negative perception of immigrants than the other classes, the reasons why are speculated in the ‘Contextualisation of variables’ section. One reason speculated is because immigrants are more likely to directly compete with the working class for jobs. The richest within society could also be more likely to appreciate the cheap labour of immigrants. Another theory is that the working class are more susceptible to the negative view of immigrant portrayed by the media. Others note the social issues such as crime, terrorism, overcrowding and pressure on public services as reasons to limit immigration.
In analysing the data, evidence shows that the majority of ‘Working Class’ respondents ‘tend to disagree’ with the statement that immigrants contribute a lot. Whereas the majority of ‘Middle Class’ and ‘Upper Class’ respondents ‘tend to agree’ with the statement. Data also suggests that the higher the social class, the more likely they are to have a positive view of immigrants; and the lower the social class, the more likely they are to have a negative view. The Chi-Squared test calculated that a relationship does seem to exist between the two variables; however Cramer’s V suggests that it is only a weak relationship. The comparison of the observed and expected results revealed that the ‘Upper Class’ display a more positive view of immigrants than expected if no relationship exists between the variables. Additionally, the ‘Working Class’ display a more negative view than expected.
To conclude, the data suggests that we are more likely to accept the operational hypothesis than the null hypothesis. The working class of society are more likely than the upper class to disagree with the statement that immigrants contribute a lot.
Recommendations for Future Research
There are many different ways in which research can be taken further. Future research could adopt a more causal style of research by asking respondents to include reasons why they view immigrants the way they do. For example, if the respondent selects ‘totally agree’ or ‘tend to agree’, what is the motivation behind their choice? Is it because they believe immigrants improve the economy? Or because they support multiculturalism? Similarly, if the respondent selects ‘totally disagree’ or ‘tend to disagree’, is it because they believe immigrants take jobs? Or because of related social issues? This sort of research allows a greater understanding of the motivation behind people’s opinion of immigrants, helping communication and gaining a greater understanding about certain viewpoints, biases or falsehoods that people have.
Future research could also include additional options to select for the ‘Social Class’ variable. For example, the introduction of ‘Lower-Middle Class’, ‘Middle-Middle Class’, and ‘Upper-Middle Class’ categories. The reason for this is because many sociologists and academics view the traditional three-class system of working class, middle class and upper class as old, outdated and necessary for modernisation. It is argued that the traditional model is incompatible with today’s society, potentially causing difficulty for respondents to answer to the social class question proficiently. If true, this could be a major limitation in the collected data. If updated to consist of more categories that better reflects today’s social class structure, respondents may find it easier to place themselves confidently into a particular social class. This would help provide more efficient data which is more proficient in reflecting today’s society.
Future research could also look at how the current data, which was collected in 2014, compares with older data sets. This would allow researchers to notice any recent trends and patterns in data emerging, and how they have changed over time.
Moreover, there are many variables different from social class which could also have an effect upon opinion of immigrants. Research could examine the influence that age has, that gender has, that ethnicity has, or that nationality has on the opinion of individuals on immigrants. All of which could have a greater or weaker strength of relationship than social class, therefore it would be useful to examine in future research.
References
Blackhurst, C. (2014). ‘Farage has made Ukip, not Labour, Britain’s most working-class party.’ The Independent. [Online] 3rd April. [Accessed 14th December 2015] http://www.independent.co.uk/voices/comment/ukip-not-labour-is-now-britain-s-most-working-class-party-9236118.html
Blinder, S. (2015). UK Public Opinion toward Immigration: Overall Attitudes and Level of Concern. Migration Observatory. Briefing University of Oxford: COMPAS. [Online] [Accessed 11th December 2015] http://www.migrationobservatory.ox.ac.uk/sites/files/migobs/Public%20Opinion-Overall%20Attitudes%20and%20Level%20of%20Concern.pdf
Chorley, M. (2014). ‘Now Ukip is beating Labour to the white working class vote, days after Miliband tried to win back white van man.’ The Daily Mail. [Online] 25th November. [Accessed 14th December 2015] http://www.dailymail.co.uk/news/article-2848526/Now-Ukip-beating-Labour-white-working-class-vote-days-Miliband-tried-win-white-van-man.html
Esses, V. Medianu, S. and Lawson, A. (2013). ‘Uncertainty, Threat, and the Role of the Media in Promoting the Dehumanization of Immigrants and Refugees.’ Journal of Social Issues, 69(3) pp. 518-536.
Healey, J. (2015). ‘Why Labour must win back working class voters from Ukip.’ The Guardian. [Online] 23rd May. [Accessed 14th December 2015] http://www.theguardian.com/commentisfree/2015/may/23/labour-win-working-class-voters-ukip
(2013). IBM SPSS Statistics Editions: Get the analytical power you need for better decision-making. United States of America. [Online] [Accessed on 7th December 2015] ftp://public.dhe.ibm.com/software/uk/pdf/YTS03009USEN.pdf
Ipsos MORI. (2015). Ipsos MORI Issues Index: August 2015. [Online] [Accessed on 11th December 2015] https://www.ipsos-mori.com/researchpublications/researcharchive/3614/EconomistIpsos-MORI-August-2015-Issues-Index.aspx
Pettinger, T. (2015). Impact of Immigration on UK Economy. Economics help. [Online] [Accessed 17th December 2015] http://www.economicshelp.org/blog/6399/economics/impact-of-immigration-on-uk-economy/
Pew Research Center. (2014). A Fragile Rebound for EU Image on Eve of European Parliament Elections. [Online] [Accessed 13th January 2016] http://www.pewglobal.org/files/2014/05/2014-05-12_Pew-Global-Attitudes-European-Union.pdf
Prosser, D. (2015). ‘Small Talk: Immigrants start businesses, create jobs and pay taxes: let’s welcome them.’ The Independent. [Online] 20th April. [Accessed 18th December 2015] http://www.independent.co.uk/news/business/sme/small-talk-immigrants-start-businesses-create-jobs-and-pay-taxes-let-s-welcome-them-10188526.html
Recknagel, C. (2015). The Rise of Europe’s New Right. Radio Free Europe Radio Liberty. [Online] [Accessed 13th January 2016] http://www.rferl.org/content/antimigrant-voices-boost-standing-as-migrant-crisis-drags-on/27316781.html
Robins-Early, N. (2015). ‘How The Refugee Crisis Is Fueling The Rise Of Europe’s Right.’ The Huffington Post. [Online] 28th October. [Accessed 13th January 2016] http://www.huffingtonpost.com/entry/europe-right-wing-refugees_562e9e64e4b06317990f1922
Thoma, M. (2006). The Debate over Immigration. [Online] [Accessed 17th December 2015] http://economistsview.typepad.com/economistsview/2006/07/the_debate_over.html
Toynbee, P. (2006). ‘Immigration is now making the rich richer and the poor poorer.’ The Guardian. [Online] 11th August. [Accessed 16th December 2015] http://www.theguardian.com/commentisfree/2006/aug/11/comment.politics
